

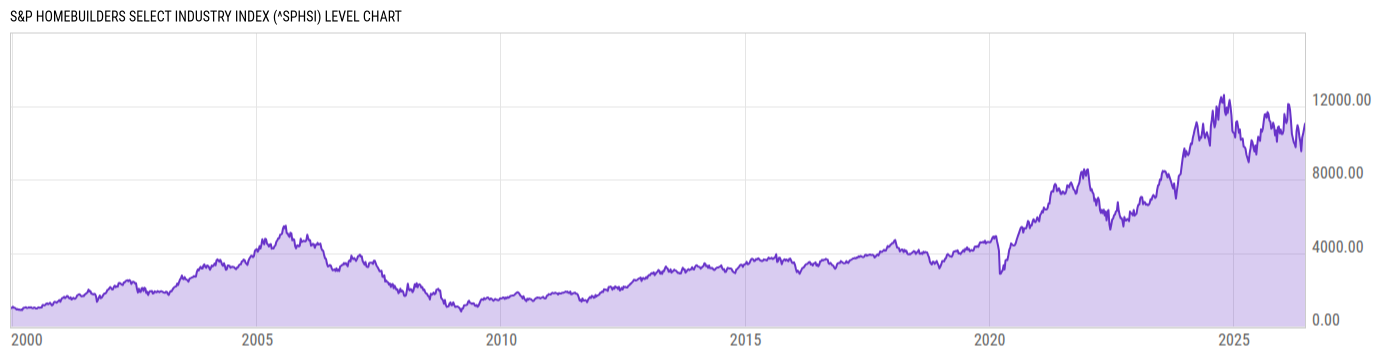
S&P Homebuilders Select Industry Index (^SPHSI)
10760.57
+378.04
(+3.64%)
USD |
Jun 09, 18:06
Level Chart
Key Stats
Basic Info
| N/A | |
| Core Index Name | S&P Homebuilders Select Industry Index |
| Return Type | Price Return |
| Currency Code | USD |
| Category Hedge Type | Not Hedged |
Index Varieties
| Return Types | |
| Net Total Return | S&P Homebuilders Select Industry Index Net Total Return |
| Total Return | S&P Homebuilders Select Industry Index Total Return |
Total Return Performance
As of June 08, 2026.
Returns for periods of 1 year and above are annualized.
Annual Performance
As of June 09, 2026.
Basic Info
| N/A | |
| Core Index Name | S&P Homebuilders Select Industry Index |
| Return Type | Price Return |
| Currency Code | USD |
| Category Hedge Type | Not Hedged |
Index Varieties
| Return Types | |
| Net Total Return | S&P Homebuilders Select Industry Index Net Total Return |
| Total Return | S&P Homebuilders Select Industry Index Total Return |